
How to Build Marketing Dashboards that Everyone Cares About
According to Gartner, 32% of CMOs believe marketing analytics and competitive insights are the most important capabilities that support marketing strategies.
However, many marketers find it challenging to demonstrate the quantitative impact of their marketing activities.
Effective marketing dashboards help address this by providing the insights needed to grow conversions, achieve goals, and scale marketing activity. This in turn makes it easier to quantify your marketing results.
In this article, we’ll explore the benefits of utilizing digital marketing dashboards and how they contribute to data-driven decisions. We’ll also share how to choose and use the right ones for your business.
Table of contents
- How marketing dashboards help you make decisions based on insights
- How to choose the right marketing dashboards for your business goals
- 3 types of marketing dashboards
- 3 marketing dashboard examples
- Which marketing KPIs should you track in your dashboards?
- How to use dashboards to increase conversions and improve the customer journey
- Key takeaways
How marketing dashboards help you make decisions based on insights
Marketing dashboards allow you to collect insights from your marketing data to help you make strategic decisions.
Relying on real-time customer data often improves your marketing activity and generates better results because you’re able to:
- Target marketing campaigns to relevant audience groups
- Deliver content you can prove is resonating
- Build messages that demonstrate engagement in a real-world setting
In particular, the best marketing dashboards afford you the following key benefits:
Proven ROI of marketing activities
Your marketing dashboard should show you more than just overall return on investment figures. Granular insights on your conversion paths and values make it easier to see and prove how your marketing efforts are contributing.
To do this, use your dashboard to track marketing costs against the flow of micro-conversions to measure the return on each stage of the customer journey.
Greater visibility for the whole company
Dashboards allow you to tailor visibility and share intelligence with everyone in the company.
Customize dashboard views for your c-suite with high-level summaries, while giving your marketing team access to much more detailed information. For example:
- Present quarterly goal and benchmark tracking, such as revenue from promotion codes and growth in email marketing sign-ups, to senior executives
- Set up a dashboard within your team to visualize the demographic data and day-to-day performance of the above metrics
Ability to make more informed decisions
Dashboards provide you with comprehensive audience data. This helps you to understand what marketing activity works or falls short.
This means you can target your communications based on proven results rather than guesswork. To achieve this:
- Clearly map your marketing campaign performance
- Use dashboard analytics to predict what alternate strategies might look like
For example, use propensity models to test whether a proposed marketing campaign is likely to spur action, such as clicking on a CTA or signing up for a demo, by referring to predictive data.
This helps you avoid wasting marketing spend on an idea that has no evidence of success.
Effective delegation to foster collaboration
Multi-user dashboard accounts foster collaboration by allowing team members to see and react to key data points.
This also simplifies delegation by expanding access throughout your team, reducing knowledge bottlenecks. For example:
- Your social media team can easily see the results of your recent Google Ads campaign on your digital marketing dashboard
- Therefore, they’re able to test the same messaging on social profiles
- Instead of waiting on other teams to share knowledge, each team has the opportunity to innovate and contribute to the whole ecosystem
Increased productivity within your team
Dashboards help you to remain productive because they remove the noise from other data sets—allowing your team to focus only on key data and progress.
This works to improve motivation, which is important for efficiency. Why? Being able to visualize challenges and successes empowers your team to make smarter (and more rewarding) decisions.
This could play out like so:
- You share a user flow dashboard to show your team how website visitors are moving through your site
- The journey indicates that 70% of website traffic to a campaign landing page is moving forward to a conversion page
- However, 20% are exiting the site at the interim stage
- Therefore, your team sees the 70% success and understands the reason behind a 20% drop off, allowing them to confidently target improvements
Time-saving with automation features
30% of businesses note that saving time is the biggest benefit of marketing automation.
Use automation to replace menial yet critical manual tasks. This frees your team up to focus on more pressing matters, like optimizing the buying journey.
Examples of tasks that can be automated include sending marketing emails and setting up advanced email segmentation campaigns. For example:
- Use an email marketing dashboard to set up triggered emails at different stages of your customer journey, such as abandoned carts and order confirmations
- Leave the automation to deliver your optimized communications at any time of the day or night based on customer actions
Constructive stakeholder management
It can be difficult to communicate the value of your marketing initiatives at the boardroom level.
To do this successfully, bring insights and recommendations to back up your ideas and decisions with key data.
Marketing dashboards provide you with this information and showcase it in a clear, concise manner. You can even tailor them for senior staff by filtering the objectives most important to them.
For example:
- During an end-of-year financial update, manipulate your dashboard to show the monetary value of each marketing conversion and how it aligns with the company’s wider financial targets
- Filter out information on brand awareness that does not have a direct impact on revenue
How to choose the right marketing dashboards for your business goals
Selecting the right marketing dashboards is not a one-size-fits-all approach. You will need to incorporate variations to cater to different stakeholders in your business.
For example, top-level executives need a snapshot to help them understand the impact of key business objectives. They are unlikely to dig deeper into the dashboard data.
On the other hand, discipline leads or managers need to not only understand the impact on wider objectives but also the data flags that indicate why certain metrics are occurring.
When choosing your marketing dashboards, keep business goals top-of-mind and consider the following:
Scalability
A dashboard should have the capacity to grow with your business.
This is important because as your business expands, you will have more marketing data to process and more users and actions to automate.
Therefore, choose dashboards that allow integration with your tools, have scalable access plans, and a wide range of automation options.
Data protection
There are legal considerations in storing customer data on your marketing dashboard. You must protect your customers’ personal data according to the rules of your region or industry.
To ensure you’re compliant, choose a marketing dashboard from a trustworthy provider and check their data protection policies.
Make sure that you also establish internal procedures to further protect both your customer and business data.
Type of metrics
Use your goals as building blocks in the decision-making process. In so doing, select dashboards that offer metrics to monitor success based on predetermined outcomes.
Rather than working with only the metrics on offer, determine what you need insight on and choose a dashboard that aligns.
Depending on your business your dashboard should cover performance metrics for:
- Website
- Ecommerce
- Social media
- Email campaigns
- Search engine optimization (SEO)
- Paid search
- Organic search
- Digital marketing
Report types
When it comes to reporting features, evaluate the level of visibility your organization requires. Ask yourself who needs access to which marketing reports and understand that this will differ across teams.
Also, decide who in your organization is responsible for sharing reports. This is important because it ensures you pay attention to all the available data rather than ignore certain chunks (intentionally or otherwise).
Automation features simplify this process by regularly sharing the right information with the right people.
Usability
A marketing dashboard should make your work life easier. Therefore, make sure yours is simple to engage with and easy for staff, both within and outside the marketing department, to understand.
Choose a dashboard that is intuitive and encourage your team to incorporate it into their daily routine. This helps you to bake data and insights into your everyday decision-making.
3 types of marketing dashboards
There are many different types of dashboards you can incorporate into your operations. Let’s explore three common examples and how they can help your marketing team make data-driven decisions.
Marketing performance dashboard
Your marketing dashboard is a high level visualization of all your marketing activities. It includes an overview of your key performance indicators (KPIs) as well as various key metrics from spend to conversion rates.
This command center provides a macro understanding of performance, but it’s most important for managers making strategic decisions.
It’s also a useful touchpoint to share with company executives as it gives them a sense of overall success without detail overwhelm.
This helps marketers demonstrate the ROI of their efforts in a condensed way. And if your initiatives aren’t successful, your marketing dashboard helps to show senior staff members why (along with opportunities to remedy).
Email marketing dashboard
As well as an overview, you also need dashboards that present more detailed information on specific aspects of your activity, such as email marketing.
Email marketing dashboards allow you to see the ROI on your email campaigns. Because email is unaffected by ever-changing algorithms (that disrupt social media and search engine strategies), email generates a high ROI ($42 for every $1 spent).
To make the most of this high ROI potential, track your email performance in a dashboard to analyze KPIs like:
- Deliverability (how many of your emails make it to inboxes)
- Spam (how many emails end up in the spam folder)
- Subscribe rate (how many people have subscribed to your email list)
- Open rate (how many emails are opened)
- Click through rate (how many people are clicking through your email)
- Unsubscribe rate (how many people remove themselves from your list)
- Bounce rate (how many emails get returned to sender)
- Conversion rate (how many people are reaching a specific goal on your website)
Sort your data by email campaigns and lists to see how well each is performing, compare A/B tests and select winners, analyze if targeted segmentation based on trigger behavior is producing desired outcomes, and so on. Also, view your email performance on the whole to track subscriber growth (or plateaus) and gauge list health.
Paid media dashboard
Justifying your overall marketing spend (as shown on your main dashboard) is only possible with an incremental view of what makes up those values.
A paid media dashboard that details these aspects is crucial for accountability. It allows you to collate data from all your digital advertising investments and link in visualization campaigns from:
- Google Ads
- Facebook Ads
- Affiliate marketing
These dashboard insights help you see indicators like the cost per acquisition (CPA) and cost per click (CPC) and determine whether it’s beneficial to continue with certain ads. If not, you can redirect spend to where it is most valuable.
3 marketing tool examples to link with your dashboards
Digital marketing dashboards cover a variety of marketing channels.
You may choose to combine a few of them into one dashboard, such as using Google Analytics to view your website data, Google Ads to analyze paid ad performance, and SEO to get a better sense of how key elements work together.
It’s more likely, however, that you’ll adopt a range of dashboards to cover your key objectives. Let’s explore some examples of popular dashboards:
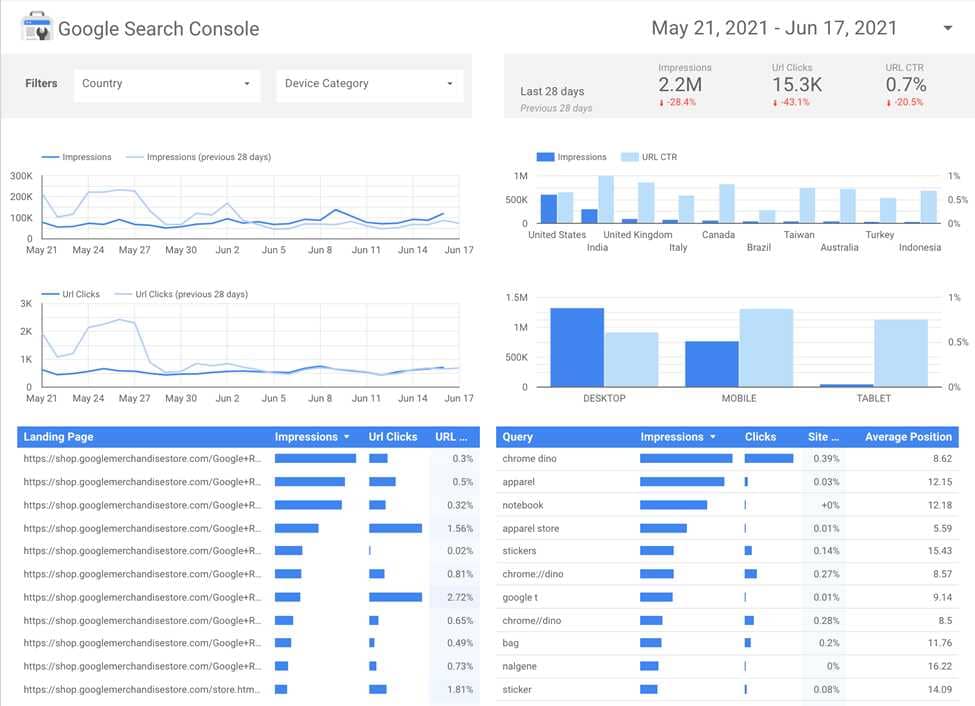
Google Data Studio
Google Data Studio is a data visualization tool that helps you turn raw data into easy-to-understand reports.
Through pre-built connectors, you can sync all of your data sources into one platform, like Google Analytics, Google Ads, or a third party.
It’s also completely customizable. Simply drag and drop preferred visuals, edit data formats, add report filters, and choose brand colors and logos for personalized touch.
When ready, choose if you’d like to grant editing, commenting, or view-only access. Collaborate with your team in real-time, and share final versions with a few clicks.
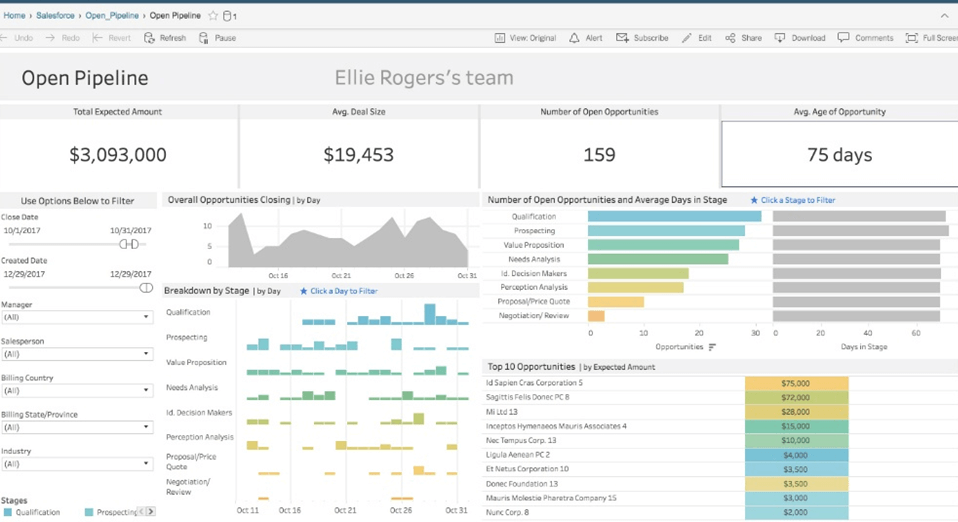
Tableau
One of the key benefits of Tableau is the ability to connect any data source. The Tableau community creates open-source connections that are easy to use, and you can even add your own integrations.
It’s also intuitive, as it uses natural language and drag-and-drop functions to create slick dashboards that incorporate a huge range of data.
Tableau provides simple but comprehensive overviews for senior executives, while managers can delve deeper with access to calculations and trendlines.
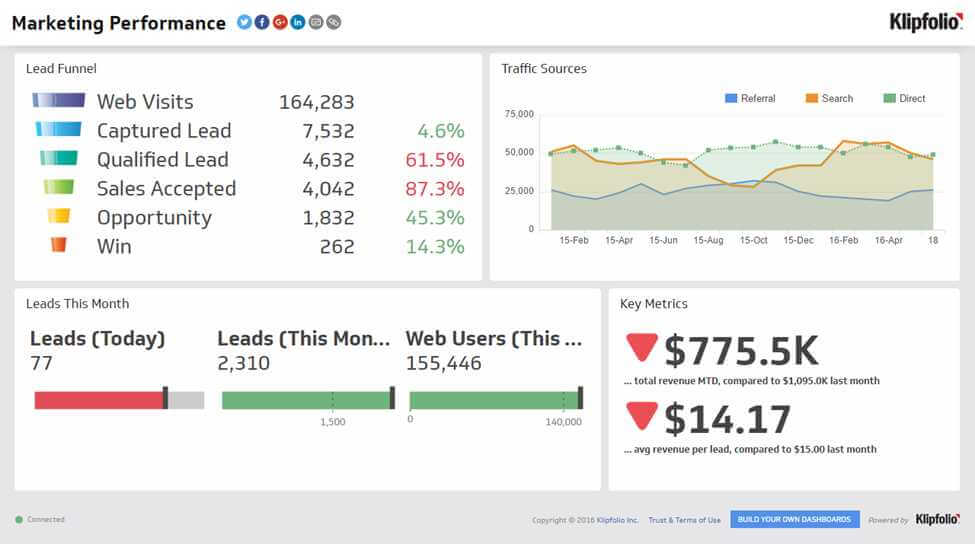
Klipfolio
Klipfolio is a self-service business intelligence platform. It includes predictive analytics, issues indicators, and graphic benchmarking to help inform your decision-making.
You don’t need to be a data expert, as Klipfolio includes templates to convert vast amounts of information into easy-to-understand dashboards.
It also integrates with hundreds of apps including Salesforce, Google Drive, and Dropbox. This makes it easy to segment and filter data from multiple sources in one place.
Which marketing KPIs should you track in your dashboards?
Choosing the right marketing dashboard is about more than what looks and feels good on the surface. To effectively build it into your strategy, you need to understand what you’re using it for.
This will help to ensure both short and long-term success and ensure you’re choosing a tool that can be leveraged to its maximum potential (and produce the highest ROI).
Keep your marketing KPIs front and center for this. Break them down into categories and assign them to the appropriate dashboard.
When doing so, avoid getting lost in data overload by focusing on the core fundamentals. These include:
Breaking down conversion metrics
Conversion KPIs are key for every business because to continue to improve conversion you need to understand more than just your number of sales.
Your website, e-commerce, and social lead generation forms house important information to analyze your conversions. Collect data on your dashboard to help understand top-level marketing metrics like:
- Conversion value of each product
- Cost per acquisition
- Average customer spend
- Average customer life cycle
It’s also important to understand micro-conversions to evaluate the true success of the entire user journey. To do this, consider:
- Percentage of users who reached a product page
- Percentage of visitors who reached the checkout
- Percentage of users who landed on a lead generation form
Data visualization of this kind helps you track and design your funnel as it gives a unique view into where potential customers might be hitting roadblocks.
Interrogating web engagement
Your website is the hub of your business’s online presence, so it’s critical to understand how visitors are using and engaging with it.
Things like page views are important but don’t mean much on their own. However, when considered as part of a set of data that actively informs your KPIs, they are gold.
For example, if your KPI is ‘X web store conversions per month’, in order to truly understand that figure, consider the following data points:
- Pageviews to determine how many times people are looking at your web store overall
- Users to see the number of individual visitors to your web store (it’s also useful to compare month-over-month or year-over-year to get a sense of growth)
- Bounce rate to see the percentage of users that leave a landing page without navigating to purchase completion or clicking a CTA
- Referrals to understand which websites people are coming to your web store from, such as your social media channels or third-party review sites
- User journey to map how users are moving through your ecommerce pages, including which pages they enter and exit on
Understanding these metrics helps you see the success value of your KPIs. That’s because a dashboard that shows the bigger picture indicates how you got there and what further opportunities you have to improve your funnel.
Track how your various KPIs change at the end of campaign periods, month-over-month, and year-over-year.
If you can gather enough statistically significant data, you may even consider delving into day-by-day and hour-by-hour metrics to understand when best to target customers.
Tracking social media performance
Understanding your social media engagement metrics is important for building brand awareness and loyalty. That’s because social media is a chief entry point to your digital experience.
Tracking social insights is much more than simply monitoring follower count. Rather, engagement is king.
That said, engagement metrics and importance will vary based on what each platform’s algorithm prioritizes. Therefore, it’s important to set your KPI dashboards to reflect what success looks like on each one.
For example, instead of tracking likes on Instagram, you can monitor ‘X increase in content saves’. Why? While not an explicit key engagement indicator, the platform is deprioritizing ‘likes’. This may mean that they are moving towards prioritizing valuable content—the action of saving a post clearly implies it resonates.
More importantly, creating valuable content boosts engagement and leads to more meaningful connections. Sharing content that is relevant enough to save is always a beneficial endeavor—regardless of whether an algorithm agrees.
Many social media platforms, such as Facebook and Instagram, have their own dashboards. However, using a multi-platform dashboard means you can bring siloed information into one place and access more comprehensive insights.
Examples of these platforms include:
- Hootsuite
- AgoraPulse
- Sprout Social
How to use dashboards to increase conversions and improve the customer journey
Let’s explore some common marketing data points that might appear on your dashboard and how you can use them to shape and improve your customer journey.
Take page views as an example. Your web analytics dashboard may show that the page views on your product page are high. Yet, it may also show the page conversion rate is low.
In a case like this, you need to diagnose the cause of this issue. It could mean a problem with your content, page speed, or user experience. Your dashboard helps you identify these red flags to further explore these elements and determine what’s blocking a higher conversion.
Once you’ve determined the cause, the data shows you how to fix it. Imagine that in this case, the problem is that your page speed is slow when someone clicks the buy-now button.
To remedy the issue, work with your developer to increase page speed by compressing images, optimizing caching, and improving your server response.
Let’s look at another example:
You’re getting a lot of reach on your social media posts but very little engagement. This likely means that your targeting is off. In other words, audiences are seeing your post but they’re not interested.
Delve into your audience analytics to gain insight on who you should be targeting. Take notice of your existing customer profiles and those who do engage with your content.
Then, redesign your targeting towards these groups. Also, check that the language you’re using in your post aligns with their interests and emotionally connects to drive action.
Respond to your dashboard insights with this analytical approach to make smarter, more strategic decisions.
Key takeaways
Marketing performance dashboards empower digital marketers to visualize, monitor, and analyze insights to inform decisions.
To choose the right dashboards for your business goals and KPIs focus on:
- Scalability
- Data protection policies
- Metric types
- Reporting functions
- Usability
This helps you develop dashboards that integrate into your long-term strategy and foster productivity and collaboration.
Adopting well-optimized dashboards helps you prove your marketing ROI, save time with automation, and create more meaningful customer journeys.
READY TO PROVIDE A BETTER POST-CLICK EXPERIENCE?
Get insights and tips to drive more business from less ad spend, more profit from less cost, and more customer value from less churn.